The K-means algorithm is an unsupervised learning algorithm that partitions a dataset into k clusters. It works by iteratively assigning data points to clusters and then updating the cluster centroids. A cluster centroid is a representative vector of the cluster in the statistical sense.
Task: To begin with, we are given a set of data points \(\{x_n\}_{n=1}^N\), \(x_n \in \mathbb{R}^d\). Our task is to group them into the given number of clusters \(K\).
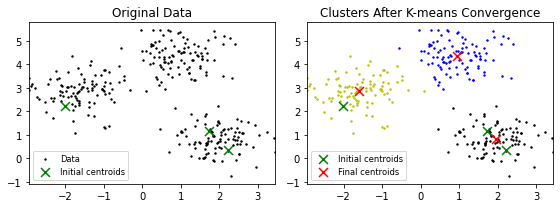
Steps: 1. Initialize the cluster centroids: \(\quad\)\(\bullet\) Randomly select \(K\) data points as the initial cluster centroids.
2. Assign data points to clusters: \(\quad\)\(\bullet\) For each data point, calculate the distance to each cluster centroid. \(\quad\)\(\bullet\) Assign the data point to the cluster with the closest centroid.
3. Update the cluster centroids: \(\quad\)\(\bullet\) For each cluster, calculate the mean of all data points assigned to it in the previous step. \(\quad\)\(\bullet\) Set the cluster centroid to the calculated mean.
4. Repeat steps 2 and 3 until convergence: \(\quad\)\(\bullet\) Convergence is reached when the cluster centroids no longer change or when a maximum number of iterations is reached.
Maths Behind it
Let’s translate these steps into the maths behind it. Notations: \(\quad\)\(\bullet\) Let \(C_k\) denotes the label of the \(k^{th}\) cluster, \(k \in \{1, 2, \dots, K\}\) \(\quad\)\(\bullet\) Consider a binary variable \[r_{nk} = \begin{cases} 1, & \text{if } x_n \text{ is assigned to cluster } C_k, \\ 0, & \text{ otherwise.} \end{cases}\]
The optimization problem for K-means clustering is defined as follows.
where \(\mu_k\) denotes the statistical mean of the data points belonging to the \(k^{th}\) cluster also referred to as the cluster centroid. This problem is solved in two phases for the unknowns \(r_{nk}\) and \(\mu_k\).
Phase 1:
Fix \(\mu_k\)’s for all \(k\) and determine \(r_{nk}\) for each \(n\) as follows. \[\begin{align}
r_{nk^*} = \begin{cases} 1, & k^* = \underset{j}{\text{arg min }} \|x_n - \mu_j\|^2, j = 1, 2, \dots, K \\ 0, & \text{ otherwise.} \end{cases}
\end{align}\] This phase translates to Step 2 above in the theory part that is the values of \(r_{nk}\) representing the cluster assignment are obtained by computing the minimum distance of each of the data points to the cluster centroids (the centroids \(\mu_k\)’s are initialized to randomly chosen data points).
Phase 2:
Fix \(r_{nk}\)’s obtained in Phase 1 and optimize for \(\mu_k\). This requires taking the derivative of Eq. (1) with respect to \(\mu_j\) and equating it to zero which gives
\[\begin{align}
\mu_j^* = \frac{\sum_n r_{nj}x_n}{\sum_n r_{nj}},~ j=1,2,\dots, K.
\end{align}\]
This translates to Step 3 above. We just computed the mean of the data points which were closest to a particular centroid. This mean value \(\mu_j^*\) represents the updated cluster centroid. Step 4 from the previous section translates to repeating Phase 1 and Phase 2 until convergence. The full algorithm is described as follows.
Algorithm:
Initialize \(\mu_k\)’s for each value \(k\) by randomly choosing \(K\) data points.
Calculate \(r_{nk}\)’s holding \(\mu_k\)’s fixed
Calculate \(\mu_k\)’s holding \(r_{nk}\)’s fixed
Repeat 2 and 3 until convergence that is \(\|\mu_k^{(t+1)} - \mu_k^{(t)}\| \approx 0~\forall k\) where \(t\) denotes the iteration number.
Output: \(\{\mu_k^*\}_{k=1}^K\) and \(\{r_{nk}^*\}_{k=1}^K\).
It should be noted that the algorithm requires prior knowledge of \(K\). In practice, this is unknown for a given dataset. There are several methods proposed in the literature to get an estimate of the number of clusters from a given dataset (Please refer or ask ChatGPT 😊!).
That’s all for this algorithm 😊! The next section provides a Python code for it.
Python Code for K-Means Algorithm
Code
# @titleimport matplotlib.pyplot as pltfrom sklearn.datasets import make_blobsimport numpy as npX, y = make_blobs(n_samples=300, centers=3, cluster_std=0.6, random_state=0) # X: N x d where N = 300, d = 2min_x, max_x =min(X[:,0]), max(X[:,0])min_y, max_y =min(X[:,1]), max(X[:,1])# Note: you can play with cluster_std to create either well separated clusters or overlapping ones
Code
# @titledef k_means_clustering(X, K, mu):""" X: N x d K: number of clusters mu: K x d """ flag =False D = [] updated_mu = mu.copy() # make a copy of current centroid# Phase 1: fix mu and find rnkfor k inrange(K):# compute distance of each of the data points from cluster centriods D += [np.sum((X - mu[k,:])**2, axis =-1)] # each member list has a shape of (K,)# find index of the closest centroid to each of the data point closest_cluster = np.argmin(D, axis =0) # cluster_class can take any value from [0, K-1] rnk = np.eye(K)[closest_cluster] # construct one-hot -> rnk: n x k# Phase 2: for fix rnk update mufor k inrange(K): data_k = X[rnk[:, k].astype(bool), :]if data_k.size !=0: updated_mu[k, :] = np.sum(data_k, axis=0) / np.sum(rnk[:, k], axis=0)else: updated_mu[k,:] = mu[k, :]# criterionif np.sum((mu - updated_mu)**2) <= np.finfo(float).eps:print("Convergence criterion met, exiting!") flag =Truereturn rnk, updated_mu, flagreturn rnk, updated_mu, flagK =3max_itr =10# initialize cluster centroids randomly from the given data pointsidx_K = np.random.randint(0, X.shape[0], K)mu = X[idx_K, :]initial_mu = mu.copy()for i inrange(max_itr): rnk, mu, flag = k_means_clustering(X, K, mu)if flag:breakif i == max_itr -1:print('Mximum iterations reached!')